CRM Dashboard
The CRM Dashboard is the central hub for sales managers and team leads to monitor key metrics, track pipeline progress, and manage daily activities in Flinkk One. It provides real-time insights into your sales performance with a comprehensive view of leads, opportunities, and business metrics.
Dashboard Overview
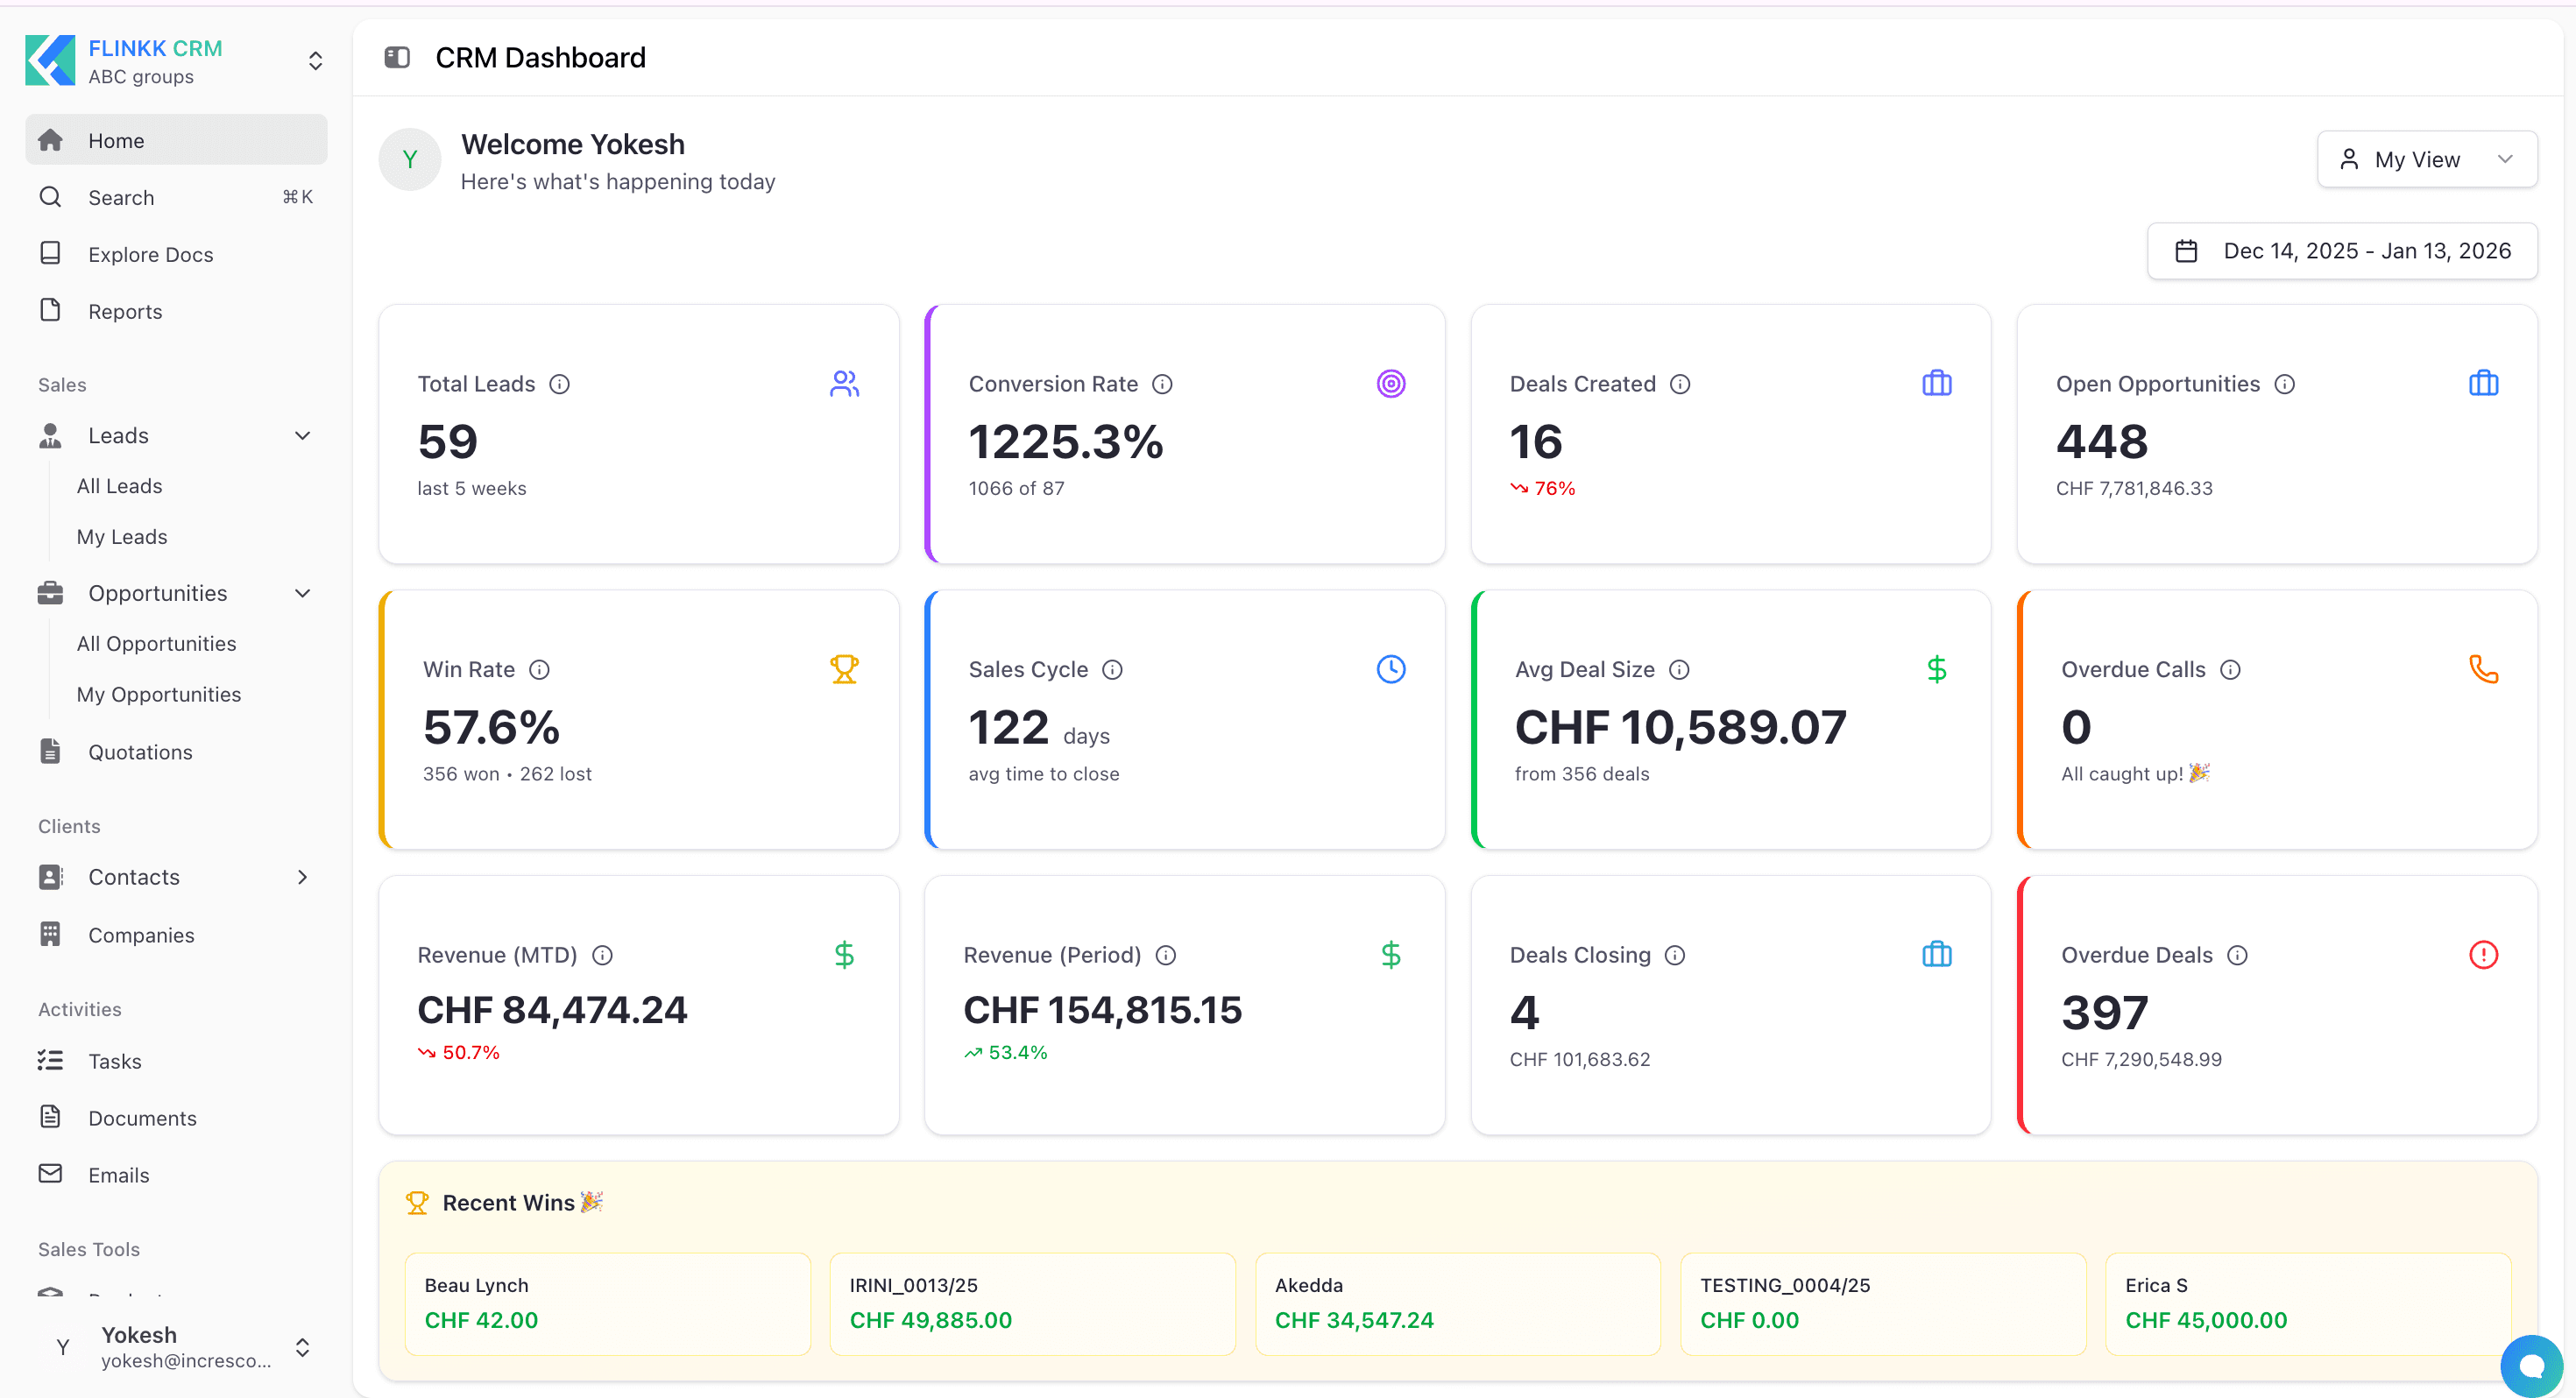
The dashboard displays a customizable layout of widgets that provide instant visibility into your sales operations. Each widget can be rearranged, customized, or hidden based on your team's priorities.
Key Metrics & Widgets
Sales Performance Indicators
The top section displays your current period's sales metrics:
- Total Leads - Number of leads captured in the current time period (e.g., last 5 weeks)
- Conversion Rate - Percentage of leads converted to opportunities (e.g., 990 of 13 = 7615.4%)
- Deals Created - Count of new opportunities/deals created with trend indicator (e.g., 6 deals, DOWN 40%)
- Open Opportunities - Total value and count of active opportunities (e.g., 393 opportunities, CHF 7,154,855.28)
Financial Metrics
Track revenue and deal performance:
- Win Rate - Percentage of deals won vs. lost (e.g., 57.3%, 342 won, 255 lost)
- Sales Cycle - Average time from deal creation to close in days (e.g., 124 days avg)
- Avg Deal Size - Average value of closed deals (e.g., CHF 10,345.98 from 342 deals)
- Revenue (MTD) - Month-to-date revenue with performance indicator
- Revenue (Period) - Revenue for selected date range
Deal Management Metrics
- Overdue Calls - Count of incomplete calls (e.g., 0 overdue)
- Deals Closing - Number and value in closing stage (e.g., 7 deals, CHF 233,745.00)
- Overdue Deals - Deals past expected close date
Data Visualization Sections
Recent Wins
Display recent closed-won deals with deal code, amount, and deal name. This celebrates team successes and provides quick reference to recent conversions.
Leads by Source (Donut Chart)
Visualizes lead distribution across acquisition sources:
- Shows total lead count in center (e.g., 13 Leads)
- Labeled for "Current Quarter" or selected period
- Helps identify most effective channels
Overdue Tasks Alert
- Displays count of incomplete tasks past due date
- Includes "View All Overdue" button for navigation
- Warning indicator for tasks needing attention
Sales Pipeline Chart
Shows opportunities across pipeline stages:
- Discovery - Early-stage prospects
- Qualified - Sales-qualified leads ready for proposal
- Proposal Sent - Awaiting customer response
- Negotiation - Active deal discussions
- Contract Sent - Near completion stage
- Closed Won - Successfully closed deals (green)
- Closed Lost - Lost opportunities (red)
Task Management Section
Track upcoming tasks with:
- Task name/title
- Due date
- Priority level (Normal, Medium, High)
- Assigned team member
- Quick action access
Dashboard Controls
Date Range Selection
- Use date picker in top-right for reporting period
- All metrics update based on selected range
- Examples: "Nov 6, 2025 - Dec 6, 2025"
View Options
- My View dropdown for layout customization
- Save preferred dashboard configuration
- Create role-specific views for teams
Using Dashboard Insights
For Sales Managers
- Review daily metrics for conversion trends
- Monitor pipeline health and stage distribution
- Identify bottlenecks in deal progression
- Celebrate wins with team
- Address overdue calls and deals immediately
For Individual Contributors
- Monitor personal performance metrics
- Manage upcoming and overdue tasks
- Understand deal placement in sales cycle
- Benchmark against team standards
Tips for Success
- Customize widgets based on team priorities
- Check dashboard daily for metric updates
- Configure alerts for critical thresholds
- Share insights in team meetings
- Keep activities logged for accurate metrics
FAQ
Q: How often do metrics update? A: Real-time updates as activities are logged. Refreshes every few seconds.
Q: Can I export dashboard data? A: Use Reports section for detailed exports. Widgets may have download options.
Q: How do I customize widgets? A: Click dashboard settings icon to add/remove widgets. Save your layout.
Q: How is the timezone handled? A: "Today" is based on organization timezone. Adjust in settings if needed.
Customizing Dashboard Metrics
Dashboard metrics are powered by the underlying module data in your CRM. To customize what appears on your dashboard, you can configure the fields, statuses, and stages for each module through the Admin Center.
Configuring Module-Specific Metrics
The dashboard metrics and KPIs are derived from your CRM modules. To modify dashboard data:
- Visit the Admin Center > Module Customization sections
- Customize fields, status options, and pipeline stages for each module
- Changes to module configurations will automatically reflect in dashboard metrics
For detailed information on customizing each module:
- Leads Module Customization - Configure Lead Status, Lead Stages, Custom Fields
- Opportunities Module Customization - Configure Opportunity Stages, Opportunity Status, Custom Fields
- Companies Module Customization - Configure Account Types, Company Status, Custom Fields
- Contacts Module Customization - Configure Contact Status, Custom Fields
- Tasks Module Customization - Configure Task Status, Task Priority, Custom Fields
- Products Module Customization - Configure Product Units, Categories, Custom Fields
- Packages Module Customization - Configure Package Status, Custom Fields
Refer to the Field Customization documentation for comprehensive guidance on adding custom fields, managing dropdowns, and setting up dynamic fields across all modules.