Reports
Reports in Flinkk One CRM provide powerful data analysis and visualization. Create customizable reports from Opportunities, Contacts, Companies, or Leads modules with charts, filters, grouping, and export capabilities to drive insights and decisions.
Overview
Turn your CRM data into actionable insights. Group by key fields, apply filters, aggregate metrics, and visualize data with charts—all without coding.
Supported Modules for Reports:
- Opportunities - Pipeline status, revenue forecasts, deal analysis, sales performance
- Contacts - Distribution analysis, organization relationships, contact segmentation
- Companies - Account information, organizational data, account analysis
- Leads - Lead sources, lead status tracking, lead pipeline
Accessing Reports
Go to Activities → Reports from the sidebar.
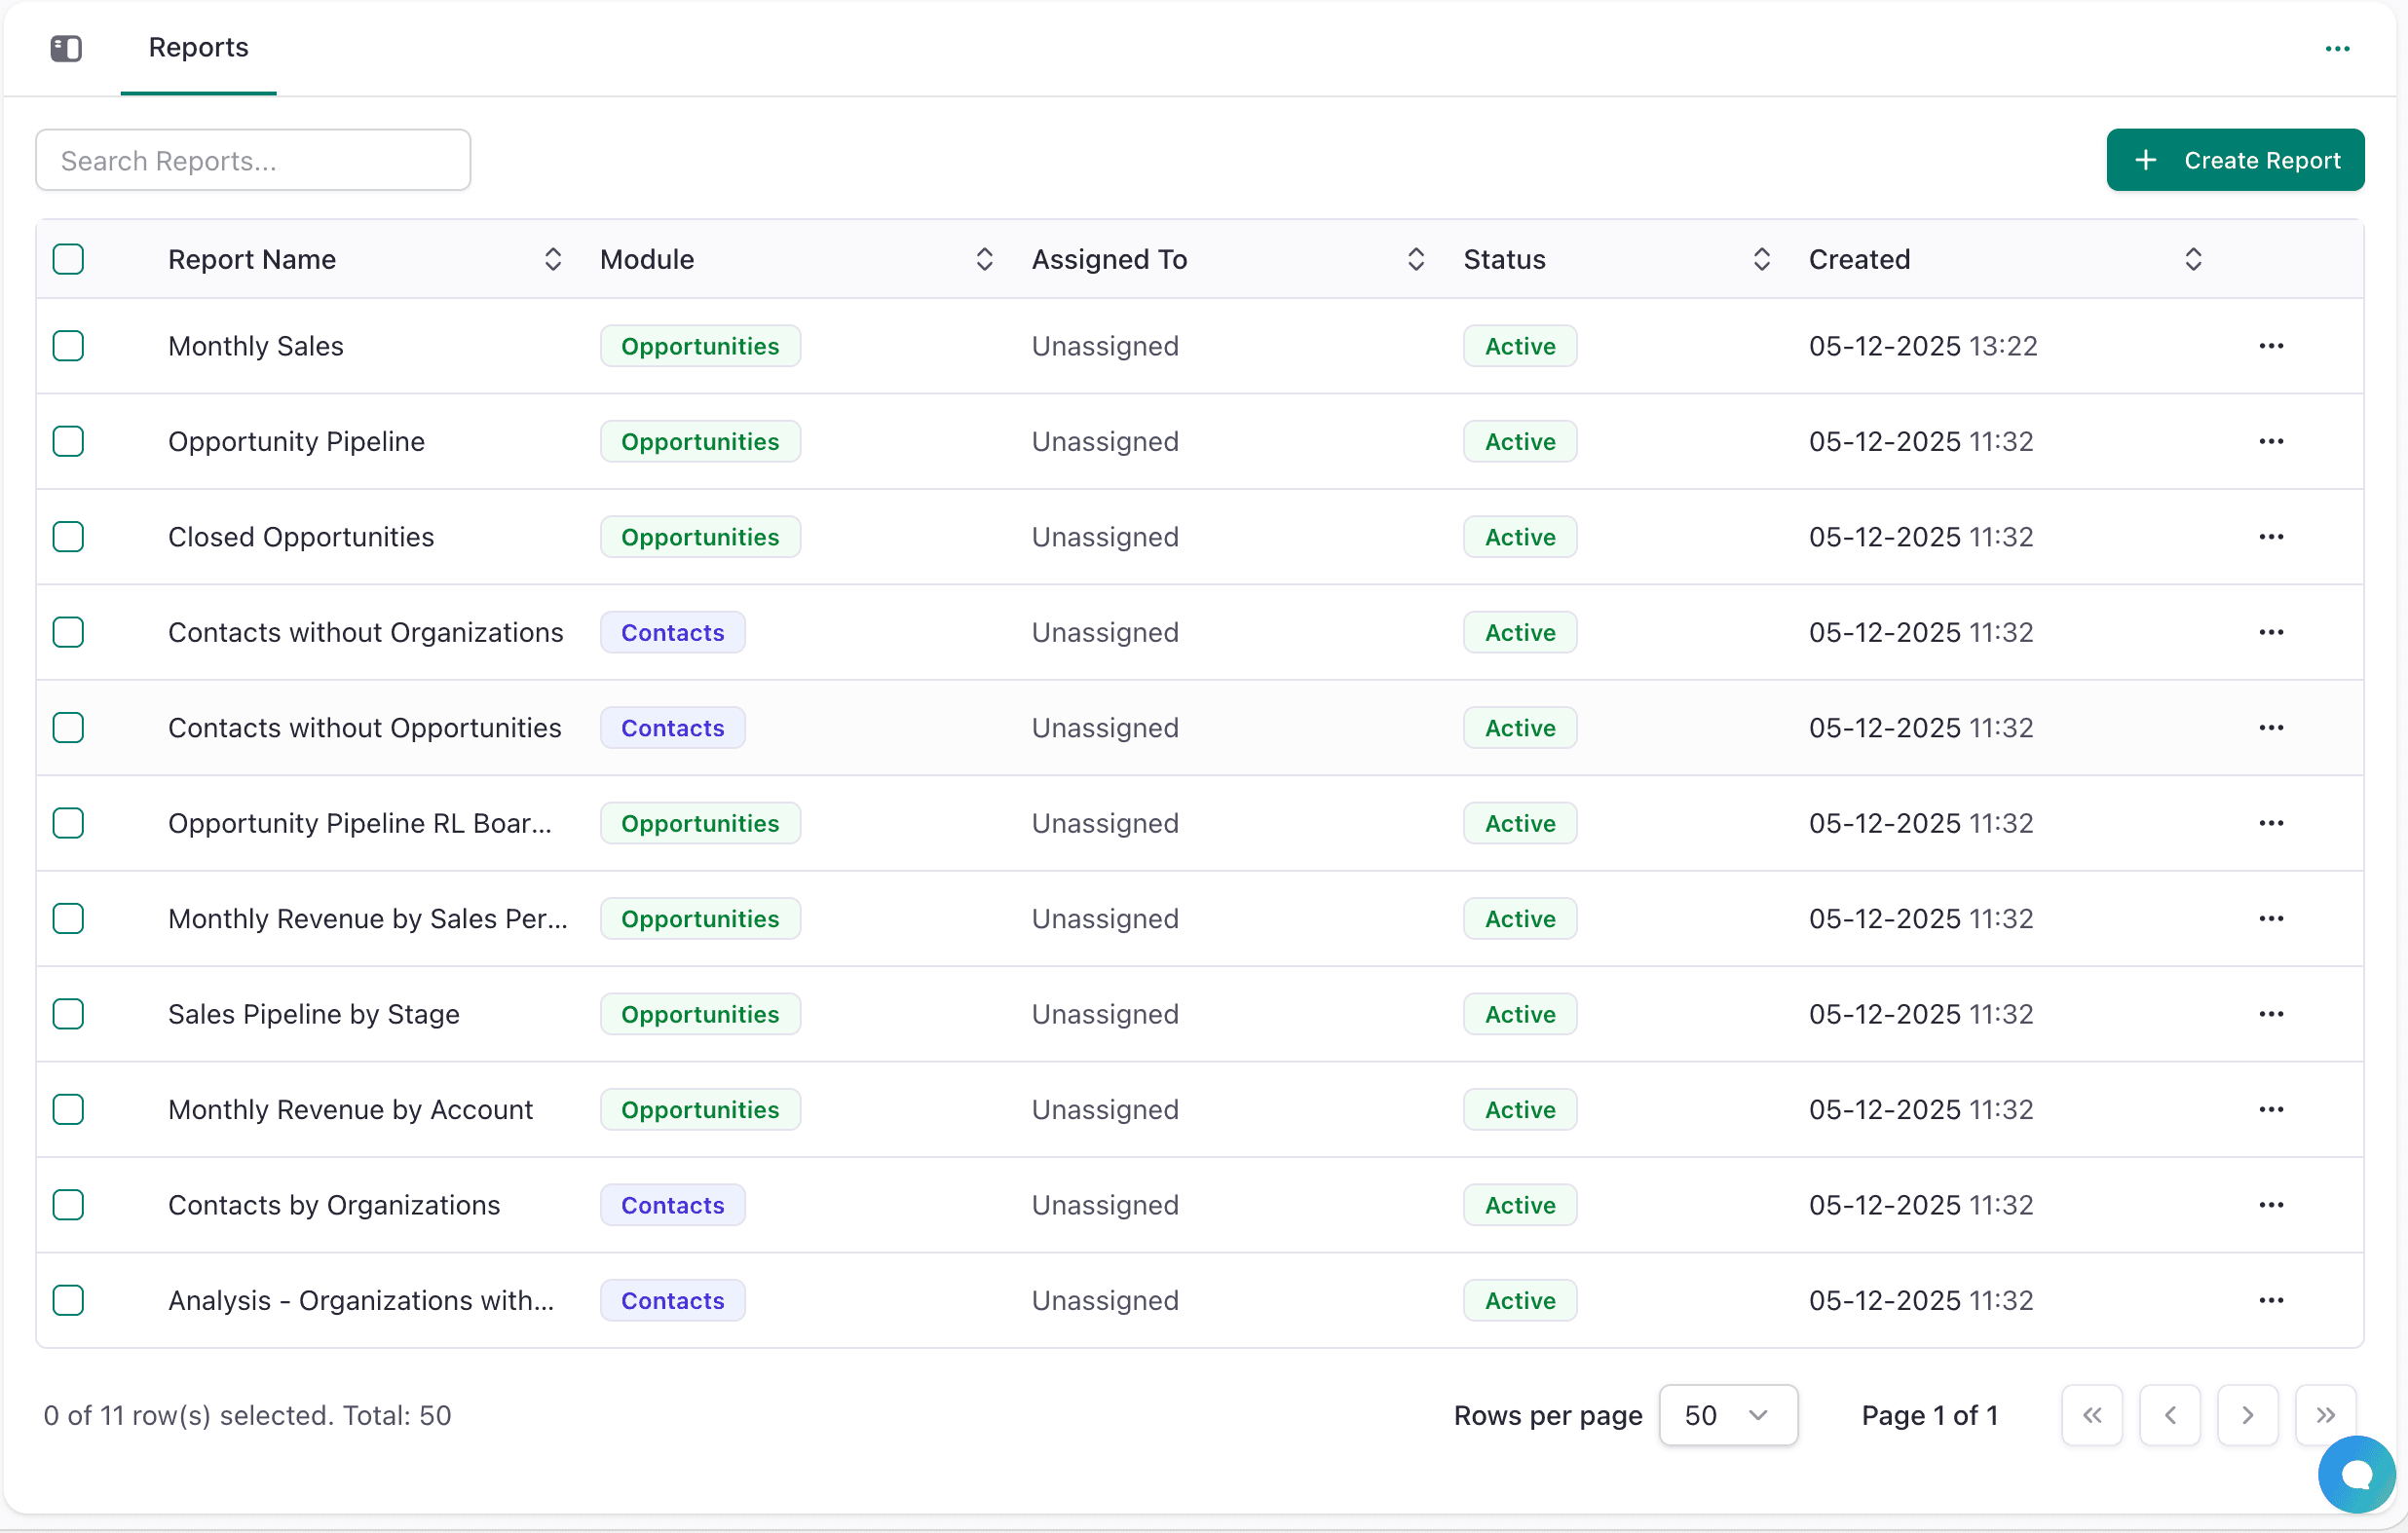
Reports List View:
- Report Name, Module source, Assigned To, Status (Active/Inactive), Created date
- Search reports by name
- Sort by any column
- Filter by status or module
- Create new reports with Create Report button
Creating Reports
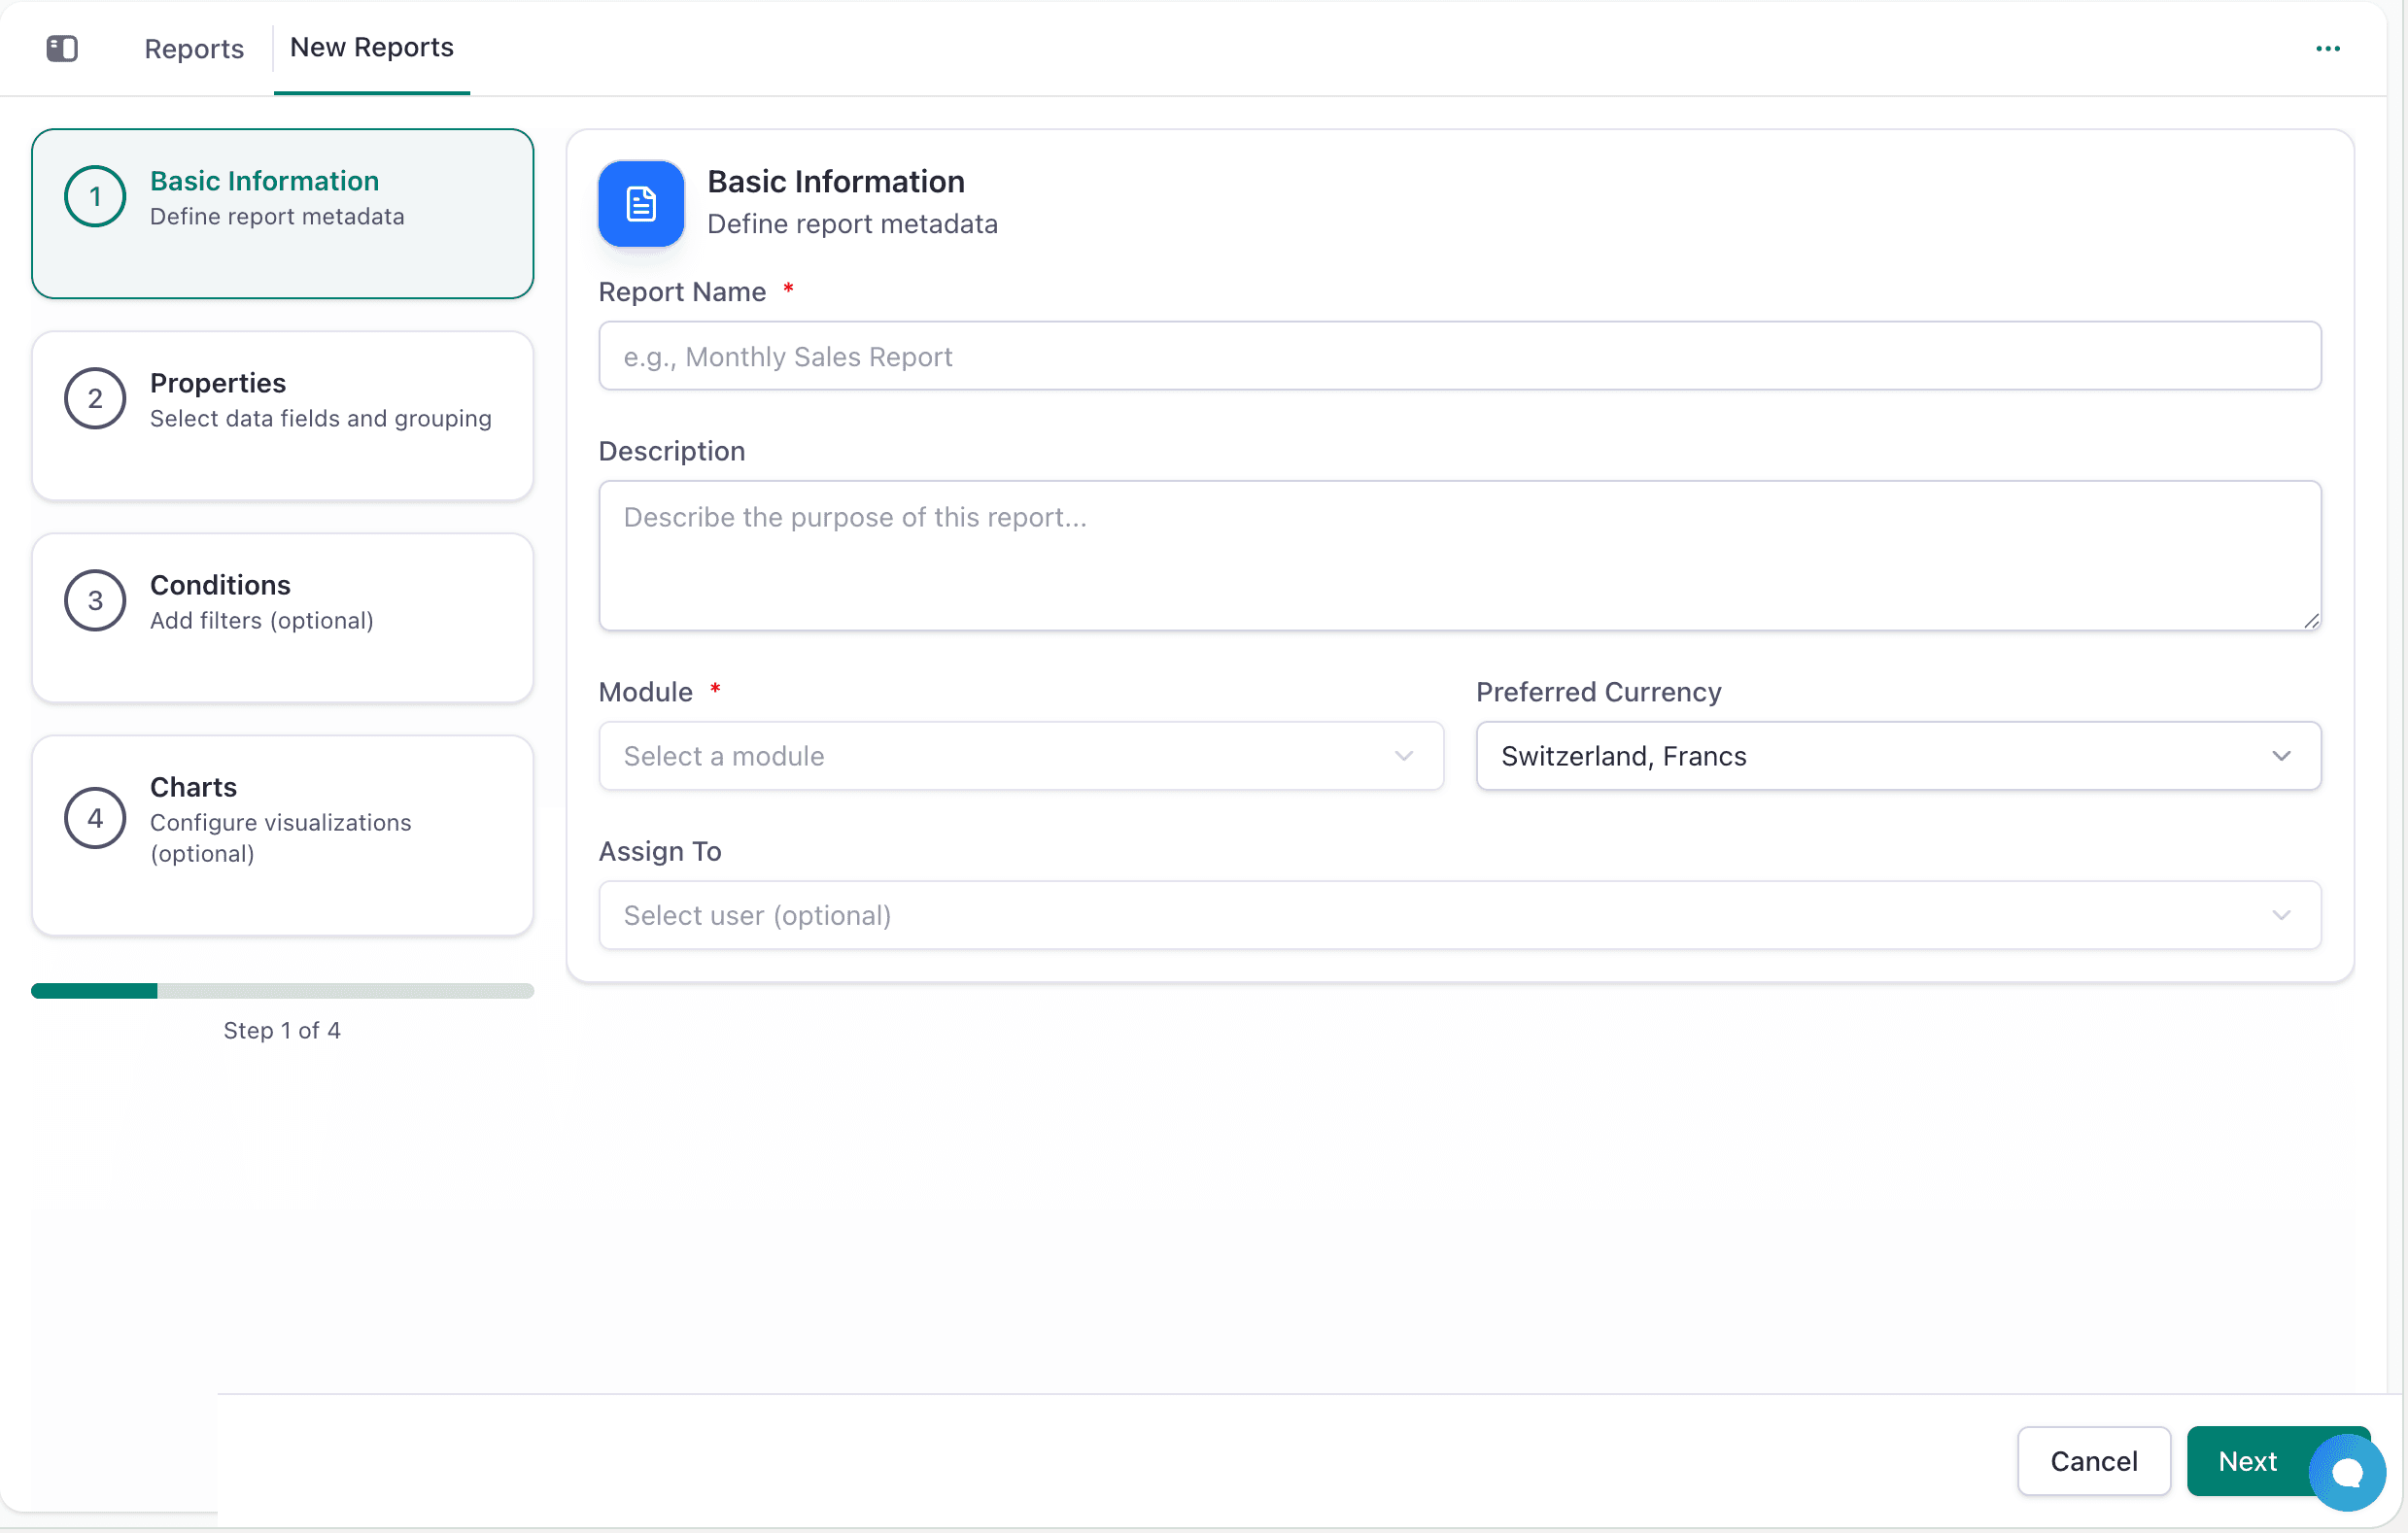
Reports are built through 4 steps:
Step 1: Basic Info
- Report Name (required) - e.g., "Monthly Sales by Region"
- Description (optional) - Purpose and details
- Module (required) - Choose Opportunities, Contacts, Companies, or Leads
- Currency - For financial data display (USD, CHF, EUR, GBP, etc.)
- Assign To (optional) - Team member responsible for report
Step 2: Properties (Grouping & Aggregation)
Group By (Row): Select 1-3 fields to group data by rows
- Example: Expected Close Date (Month), Stage, Salesperson
Group By (Column): Optionally add fields for column-based pivoting (creates cross-tabulation)
Aggregate Columns: Define how to summarize numeric data
- Sum - Total (for Opportunity Value)
- Count - Record count
- Average - Mean value
- Min/Max - Minimum/Maximum value
Data Fields: Select specific fields to include (leave empty for all available fields)
Step 3: Conditions (Filtering)
Add filters to narrow data:
- Field - Which field to filter
- Operator - Equals, Contains, Greater Than, Less Than, etc.
- Value - The specific value
Add multiple conditions to refine results. System shows Matching Records count so you can verify filters.
Step 4: Charts (Optional)
Create visual representations:
- Chart Type - Bar, Line, Pie, Area, etc.
- X-Axis - Field for horizontal axis
- Y-Axis - Field for vertical axis (typically aggregated value)
- Data Series - Optional grouping for multi-series charts
Skip this step to show data table only.
Viewing Reports
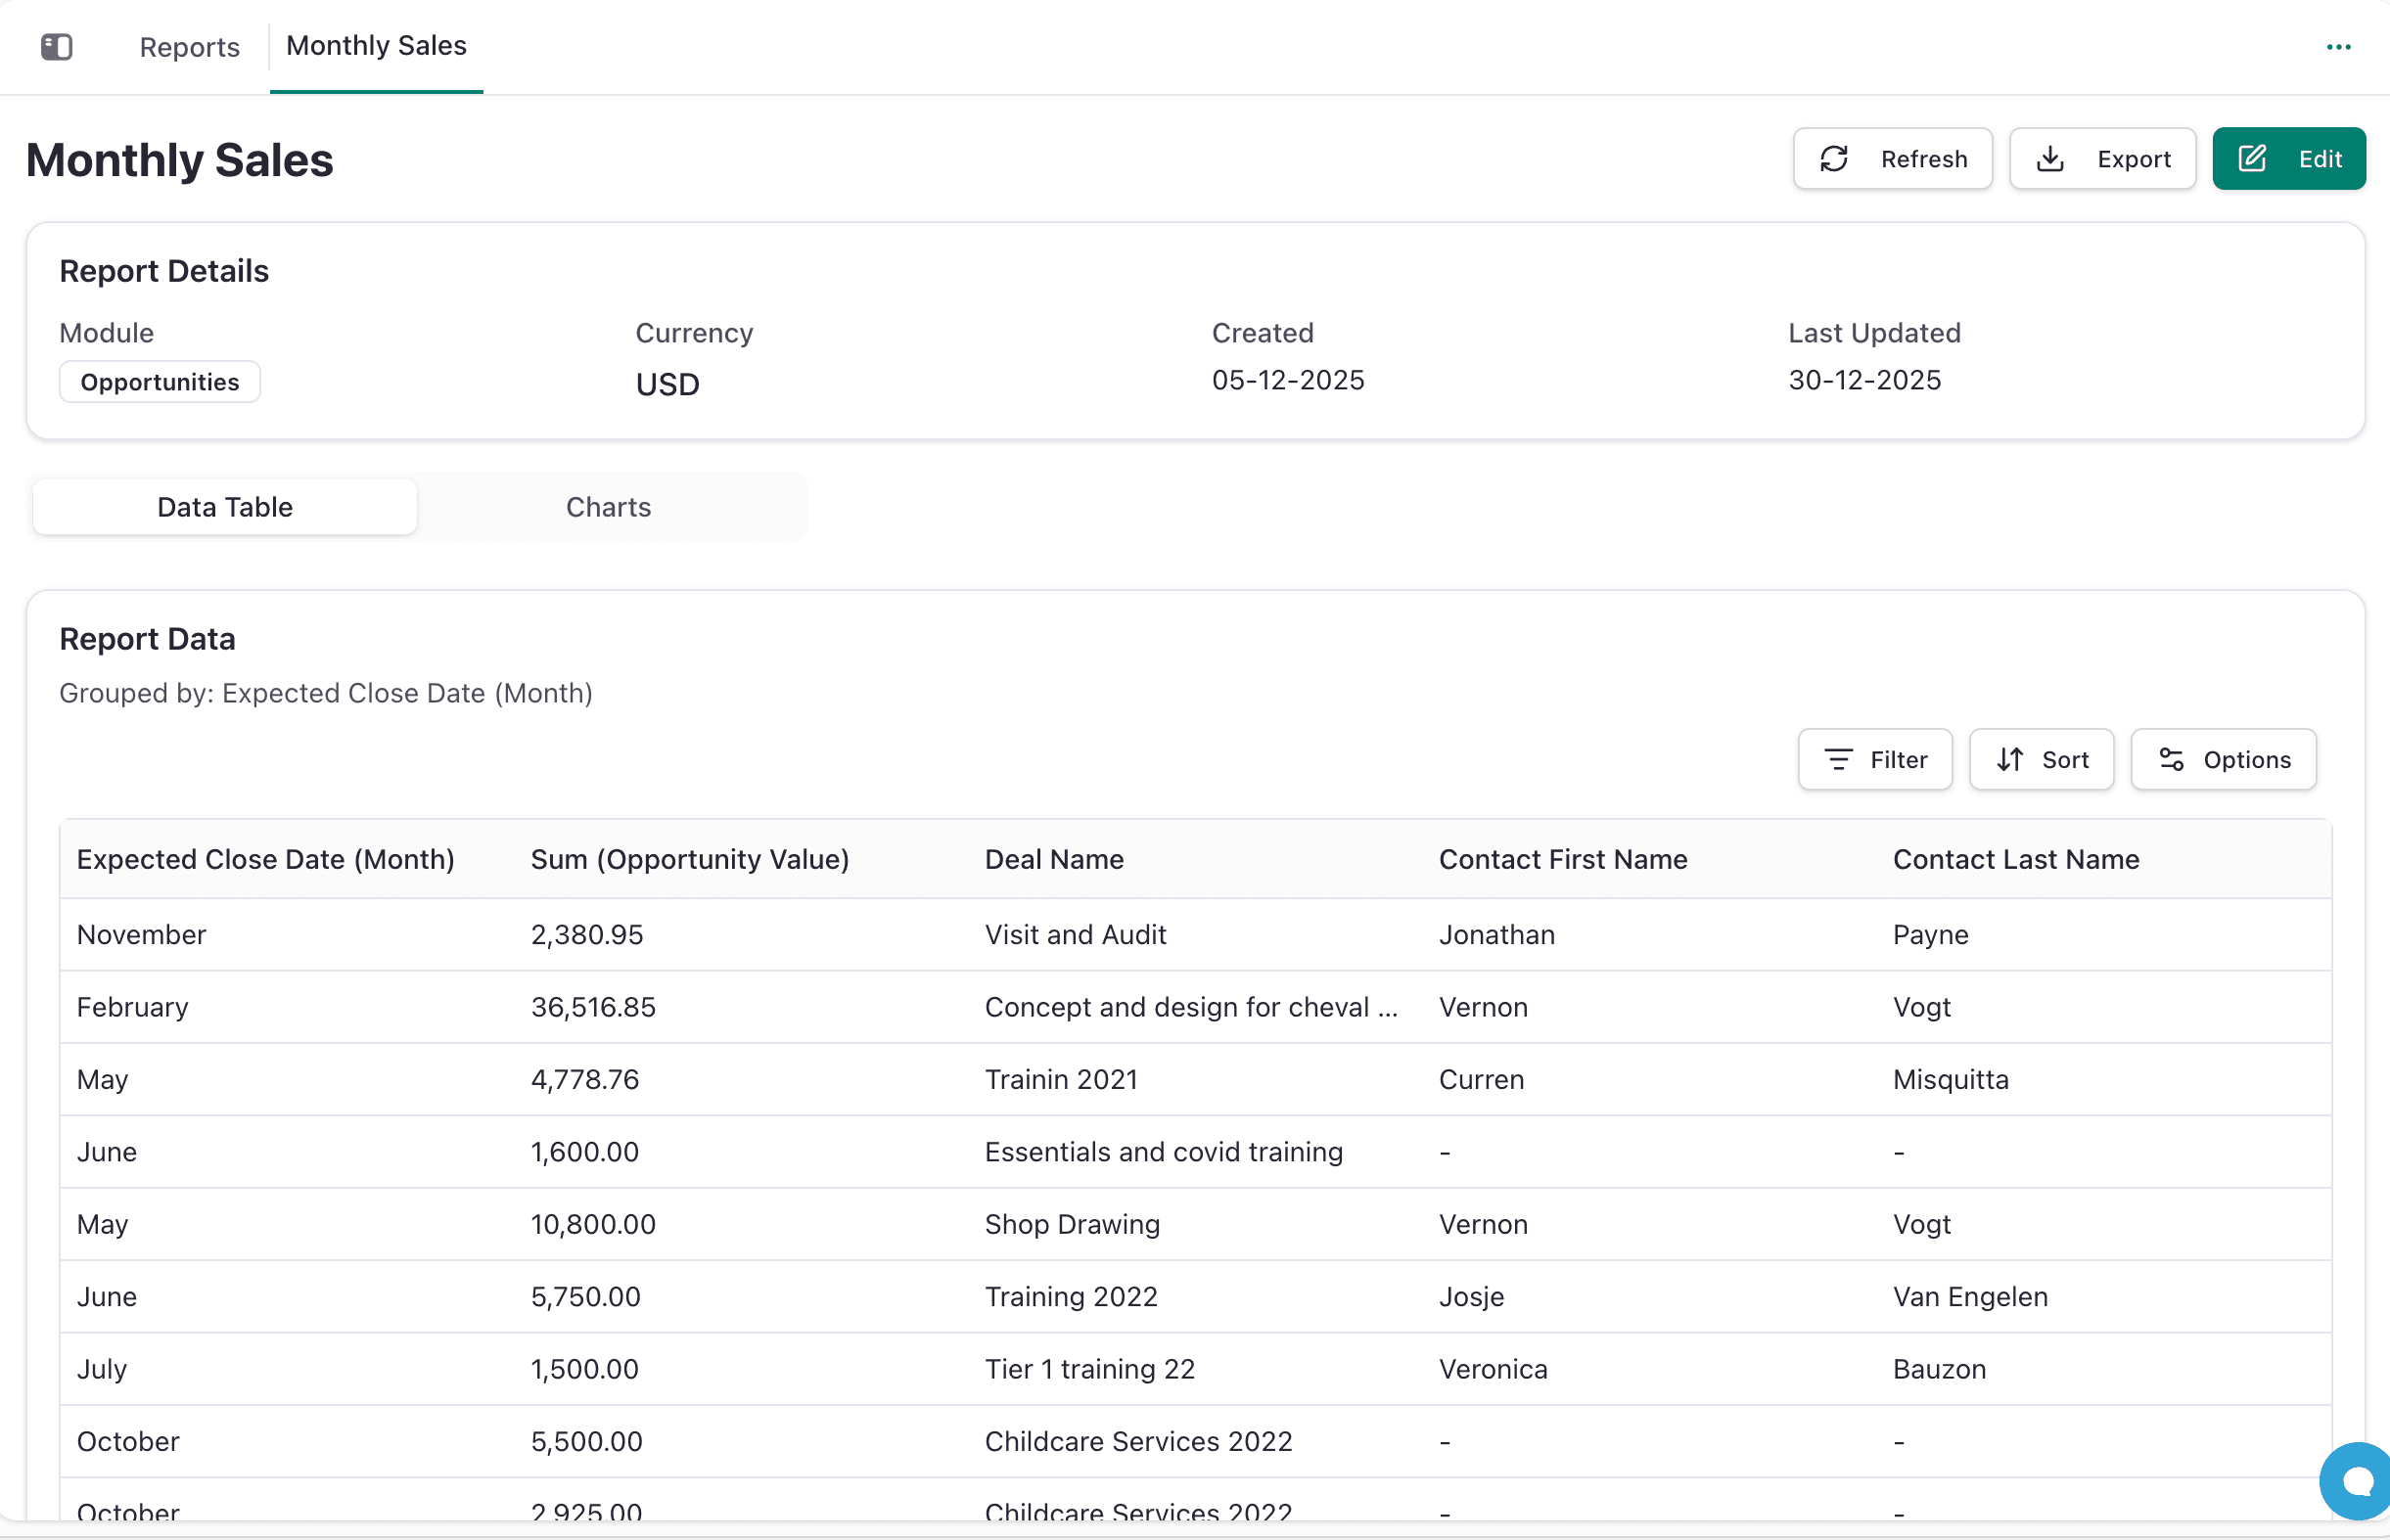
Report Details:
- Module, Currency, Created date, Last Updated
- Two view options: Data Table and Charts (if configured)
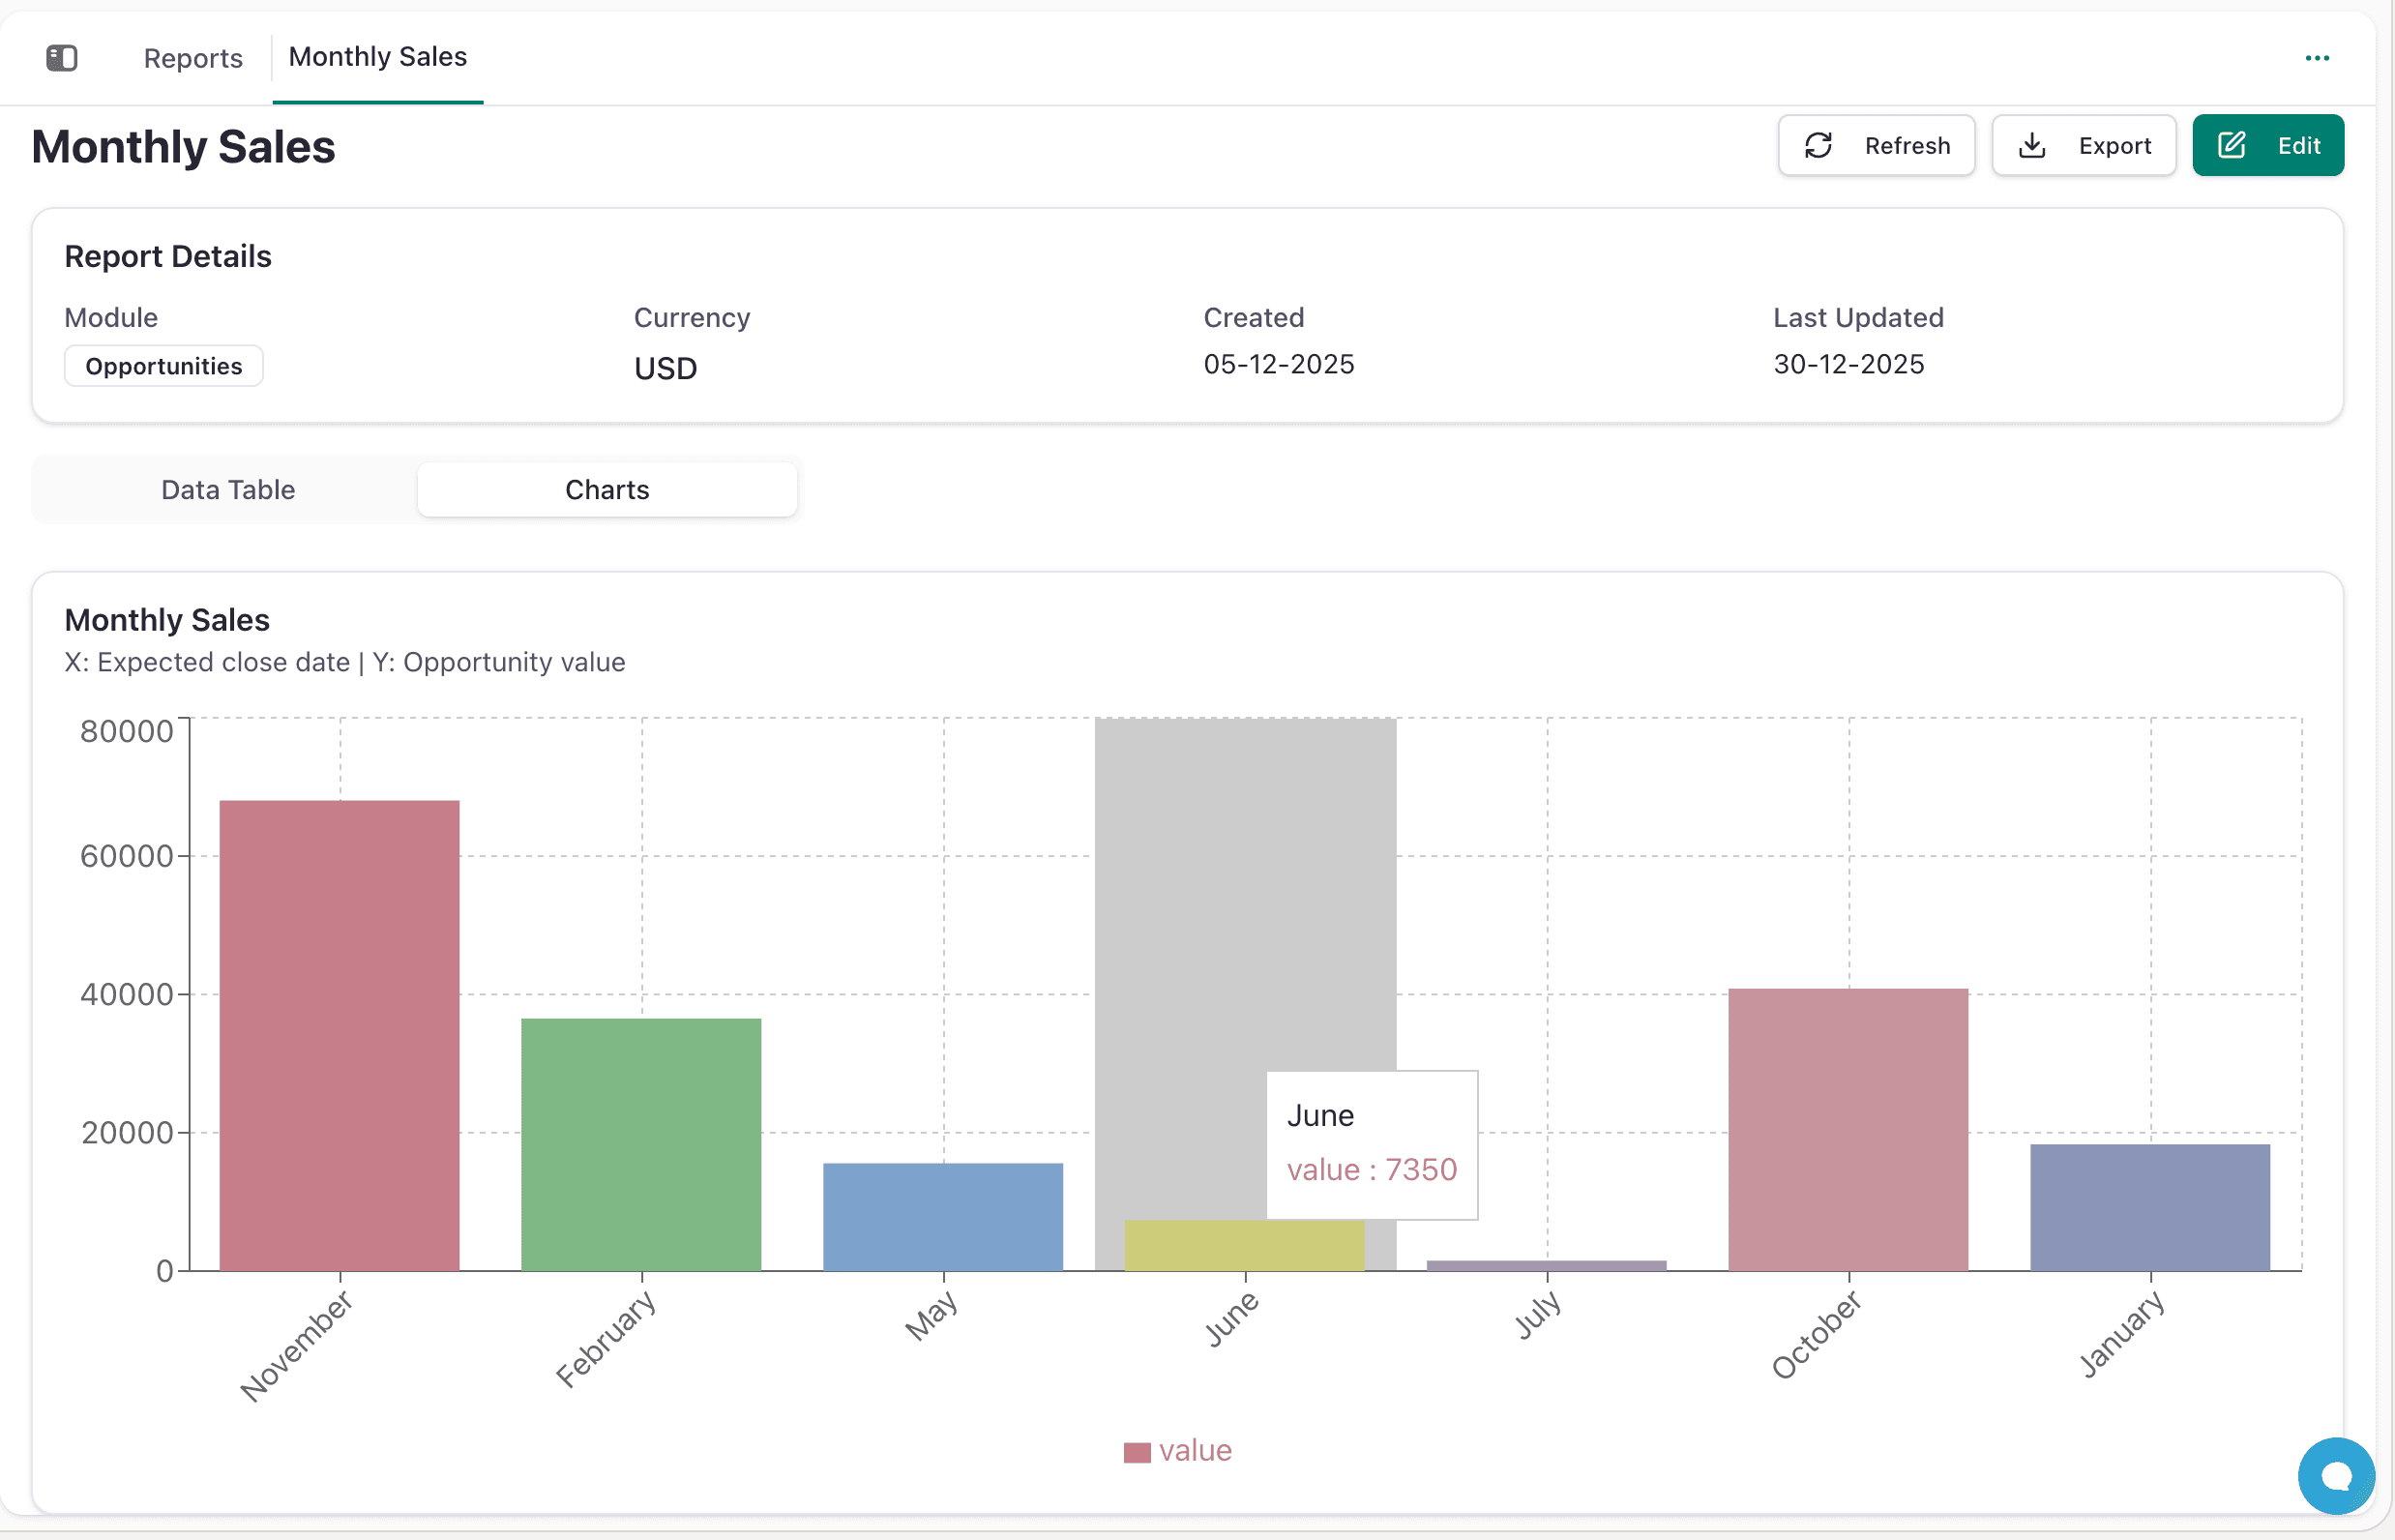
Report Actions:
- Refresh - Reload latest data
- Export - Download data to CSV/Excel
- Edit - Modify report configuration
Table Controls:
- Filter - Add temporary filters on top of report's conditions
- Sort - Change data ordering
- Options - Display settings
- Pagination - Select rows per page (default 50), navigate pages
Common Report Examples
Monthly Sales Report (Opportunities)
- Grouped by: Expected Close Date (Month)
- Aggregated: Sum of Opportunity Value
- Show revenue trends month by month
Sales by Stage Report (Opportunities)
- Grouped by: Stage, Salesperson
- Aggregated: Sum of Value, Count of Opportunities
- Track pipeline distribution
Revenue by Region (Opportunities)
- Grouped by: Company Territory/Region
- Aggregated: Sum of Won Opportunities
- Compare regional performance
Contacts by Company (Contacts)
- Grouped by: Account/Company
- Show: Contact names, titles, emails
- Organize contacts by organization
Unlinked Contacts (Contacts)
- Filtered: Where Account is empty
- Show: Contacts not yet assigned to companies
- Data quality view
Best Practices
- Clear names: "Monthly Revenue by Salesperson" not "Sales Report 1"
- Meaningful grouping: Group by 1-2 important fields for clarity
- Verify filters: Check Matching Records count to ensure correct data
- Multiple aggregations: Add Count AND Sum for comprehensive view
- Regular updates: Check "Last Updated" to confirm data freshness
- Export for sharing: Use Export for stakeholders who need the data
Troubleshooting
Report shows no data?
- Verify module has records
- Check filter conditions in Step 3
- Review Matching Records count
- Ensure correct fields selected in Step 2
Unexpected data?
- Review filters and conditions
- Verify correct module selected
- Check aggregation functions
- Refresh to reload data
Chart not displaying?
- Ensure Step 4 (Charts) was configured
- Verify aggregation is selected for Y-axis
- Check that data exists after filtering
- Switch to Data Table tab if still not visible
Next Steps
- Track Opportunities - Create Opportunity-based reports
- Manage Contacts - Build Contact analysis reports
- Manage Companies - Generate account reports
- View Leads - Create Lead pipeline reports